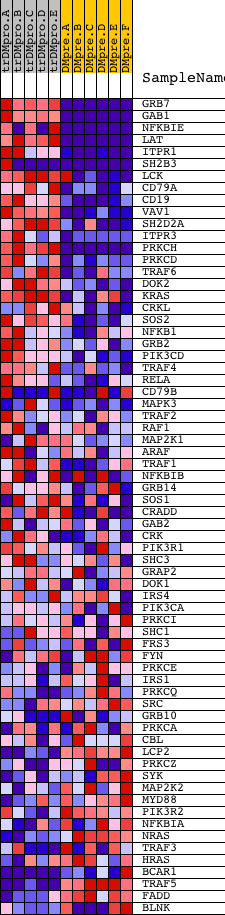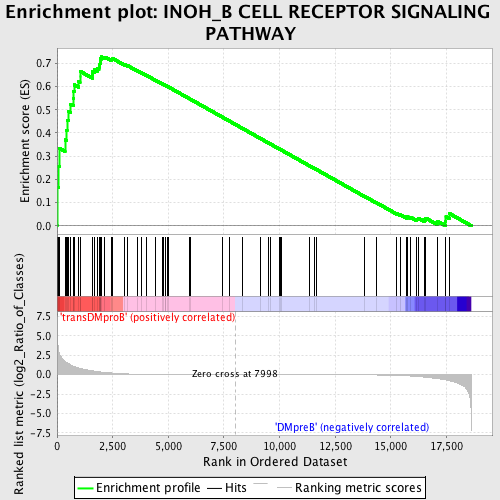
Profile of the Running ES Score & Positions of GeneSet Members on the Rank Ordered List
| Dataset | Set_04_transDMproB_versus_DMpreB.phenotype_transDMproB_versus_DMpreB.cls #transDMproB_versus_DMpreB.phenotype_transDMproB_versus_DMpreB.cls #transDMproB_versus_DMpreB_repos |
| Phenotype | phenotype_transDMproB_versus_DMpreB.cls#transDMproB_versus_DMpreB_repos |
| Upregulated in class | transDMproB |
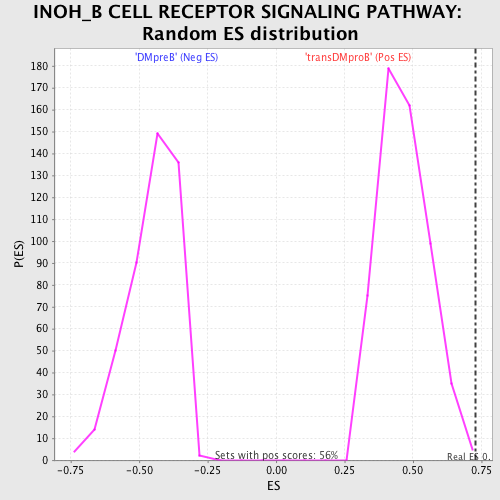
| GeneSet | INOH_B CELL RECEPTOR SIGNALING PATHWAY |
| Enrichment Score (ES) | 0.72800165 |
| Normalized Enrichment Score (NES) | 1.566305 |
| Nominal p-value | 0.0036036037 |
| FDR q-value | 0.14197086 |
| FWER p-Value | 0.647 |
| PROBE | DESCRIPTION (from dataset) | GENE SYMBOL | GENE_TITLE | RANK IN GENE LIST | RANK METRIC SCORE | RUNNING ES | CORE ENRICHMENT | |
|---|---|---|---|---|---|---|---|---|
| 1 | GRB7 | 20673 | 5 | 5.748 | 0.1668 | Yes | ||
| 2 | GAB1 | 18828 | 64 | 3.185 | 0.2563 | Yes | ||
| 3 | NFKBIE | 23225 1556 | 96 | 2.766 | 0.3350 | Yes | ||
| 4 | LAT | 17643 | 357 | 1.694 | 0.3703 | Yes | ||
| 5 | ITPR1 | 17341 | 418 | 1.573 | 0.4128 | Yes | ||
| 6 | SH2B3 | 5001 16383 | 449 | 1.532 | 0.4557 | Yes | ||
| 7 | LCK | 15746 | 521 | 1.410 | 0.4928 | Yes | ||
| 8 | CD79A | 18342 | 611 | 1.251 | 0.5244 | Yes | ||
| 9 | CD19 | 17640 | 735 | 1.071 | 0.5489 | Yes | ||
| 10 | VAV1 | 23173 | 746 | 1.053 | 0.5790 | Yes | ||
| 11 | SH2D2A | 6569 | 771 | 1.025 | 0.6075 | Yes | ||
| 12 | ITPR3 | 9195 | 959 | 0.861 | 0.6224 | Yes | ||
| 13 | PRKCH | 21246 | 1030 | 0.813 | 0.6423 | Yes | ||
| 14 | PRKCD | 21897 | 1031 | 0.813 | 0.6659 | Yes | ||
| 15 | TRAF6 | 5797 14940 | 1581 | 0.489 | 0.6505 | Yes | ||
| 16 | DOK2 | 354 | 1598 | 0.481 | 0.6636 | Yes | ||
| 17 | KRAS | 9247 | 1683 | 0.444 | 0.6720 | Yes | ||
| 18 | CRKL | 4560 | 1800 | 0.391 | 0.6771 | Yes | ||
| 19 | SOS2 | 21049 | 1883 | 0.362 | 0.6832 | Yes | ||
| 20 | NFKB1 | 15160 | 1890 | 0.360 | 0.6934 | Yes | ||
| 21 | GRB2 | 20149 | 1927 | 0.347 | 0.7016 | Yes | ||
| 22 | PIK3CD | 9563 | 1939 | 0.342 | 0.7109 | Yes | ||
| 23 | TRAF4 | 10217 5796 1400 | 1949 | 0.340 | 0.7203 | Yes | ||
| 24 | RELA | 23783 | 1985 | 0.329 | 0.7280 | Yes | ||
| 25 | CD79B | 20185 1309 | 2150 | 0.281 | 0.7273 | No | ||
| 26 | MAPK3 | 6458 11170 | 2440 | 0.214 | 0.7180 | No | ||
| 27 | TRAF2 | 14657 | 2502 | 0.200 | 0.7205 | No | ||
| 28 | RAF1 | 17035 | 3038 | 0.101 | 0.6946 | No | ||
| 29 | MAP2K1 | 19082 | 3174 | 0.087 | 0.6898 | No | ||
| 30 | ARAF | 24367 | 3602 | 0.052 | 0.6683 | No | ||
| 31 | TRAF1 | 14611 | 3799 | 0.042 | 0.6590 | No | ||
| 32 | NFKBIB | 17906 | 4038 | 0.031 | 0.6471 | No | ||
| 33 | GRB14 | 14574 2719 | 4432 | 0.021 | 0.6265 | No | ||
| 34 | SOS1 | 5476 | 4722 | 0.015 | 0.6113 | No | ||
| 35 | CRADD | 19640 | 4762 | 0.015 | 0.6097 | No | ||
| 36 | GAB2 | 1821 18184 2025 | 4849 | 0.013 | 0.6054 | No | ||
| 37 | CRK | 4559 1249 | 4892 | 0.013 | 0.6035 | No | ||
| 38 | PIK3R1 | 3170 | 4940 | 0.013 | 0.6014 | No | ||
| 39 | SHC3 | 21465 | 5022 | 0.012 | 0.5973 | No | ||
| 40 | GRAP2 | 5113 9398 | 5964 | 0.006 | 0.5468 | No | ||
| 41 | DOK1 | 17104 1018 1177 | 5995 | 0.006 | 0.5453 | No | ||
| 42 | IRS4 | 9183 4926 | 7412 | 0.001 | 0.4690 | No | ||
| 43 | PIK3CA | 9562 | 7760 | 0.001 | 0.4503 | No | ||
| 44 | PRKCI | 9576 | 8313 | -0.001 | 0.4206 | No | ||
| 45 | SHC1 | 9813 9812 5430 | 9137 | -0.003 | 0.3763 | No | ||
| 46 | FRS3 | 23209 | 9495 | -0.004 | 0.3572 | No | ||
| 47 | FYN | 3375 3395 20052 | 9586 | -0.004 | 0.3524 | No | ||
| 48 | PRKCE | 9575 | 10001 | -0.005 | 0.3303 | No | ||
| 49 | IRS1 | 4925 | 10028 | -0.005 | 0.3290 | No | ||
| 50 | PRKCQ | 2873 2831 | 10097 | -0.005 | 0.3255 | No | ||
| 51 | SRC | 5507 | 11341 | -0.009 | 0.2587 | No | ||
| 52 | GRB10 | 4799 | 11584 | -0.010 | 0.2460 | No | ||
| 53 | PRKCA | 20174 | 11674 | -0.011 | 0.2415 | No | ||
| 54 | CBL | 19154 | 13815 | -0.033 | 0.1271 | No | ||
| 55 | LCP2 | 4988 9268 | 14343 | -0.045 | 0.1000 | No | ||
| 56 | PRKCZ | 5260 | 15276 | -0.095 | 0.0525 | No | ||
| 57 | SYK | 21636 | 15422 | -0.112 | 0.0480 | No | ||
| 58 | MAP2K2 | 19933 | 15726 | -0.151 | 0.0360 | No | ||
| 59 | MYD88 | 18970 | 15739 | -0.152 | 0.0398 | No | ||
| 60 | PIK3R2 | 18850 | 15900 | -0.181 | 0.0364 | No | ||
| 61 | NFKBIA | 21065 | 16172 | -0.230 | 0.0285 | No | ||
| 62 | NRAS | 5191 | 16222 | -0.243 | 0.0329 | No | ||
| 63 | TRAF3 | 21147 | 16513 | -0.314 | 0.0264 | No | ||
| 64 | HRAS | 4868 | 16569 | -0.329 | 0.0330 | No | ||
| 65 | BCAR1 | 18741 | 17079 | -0.500 | 0.0201 | No | ||
| 66 | TRAF5 | 13718 | 17467 | -0.682 | 0.0191 | No | ||
| 67 | FADD | 17536 8950 4711 | 17479 | -0.686 | 0.0384 | No | ||
| 68 | BLNK | 23681 3691 | 17637 | -0.784 | 0.0528 | No |